Design Diversity Index
Professional Workforce Data
In addition to tracking demographic data from academic programs, the Design Diversity Index includes data on the racial representation of design professionals. Professional employment data aligns with the third passage in the Design Journey: Workforce. Once students of color graduate from academic design programs, many enter the professional world only to encounter additional barriers to overcome. Whether working for a large design firm or as an entrepreneur, challenges faced by people of color during the Workforce passage divert many away from continuing on the Design Journey. The fourth passage, Influence, involves promotion to senior leadership and mentorship roles within the design professions. Although the Design Diversity Index does not currently track data on the influence or seniority of people of color in the design professions, future versions of the tool may expand to this final passage. For now, the Design Diversity Index collects available demographic data on designers employed in Ohio.
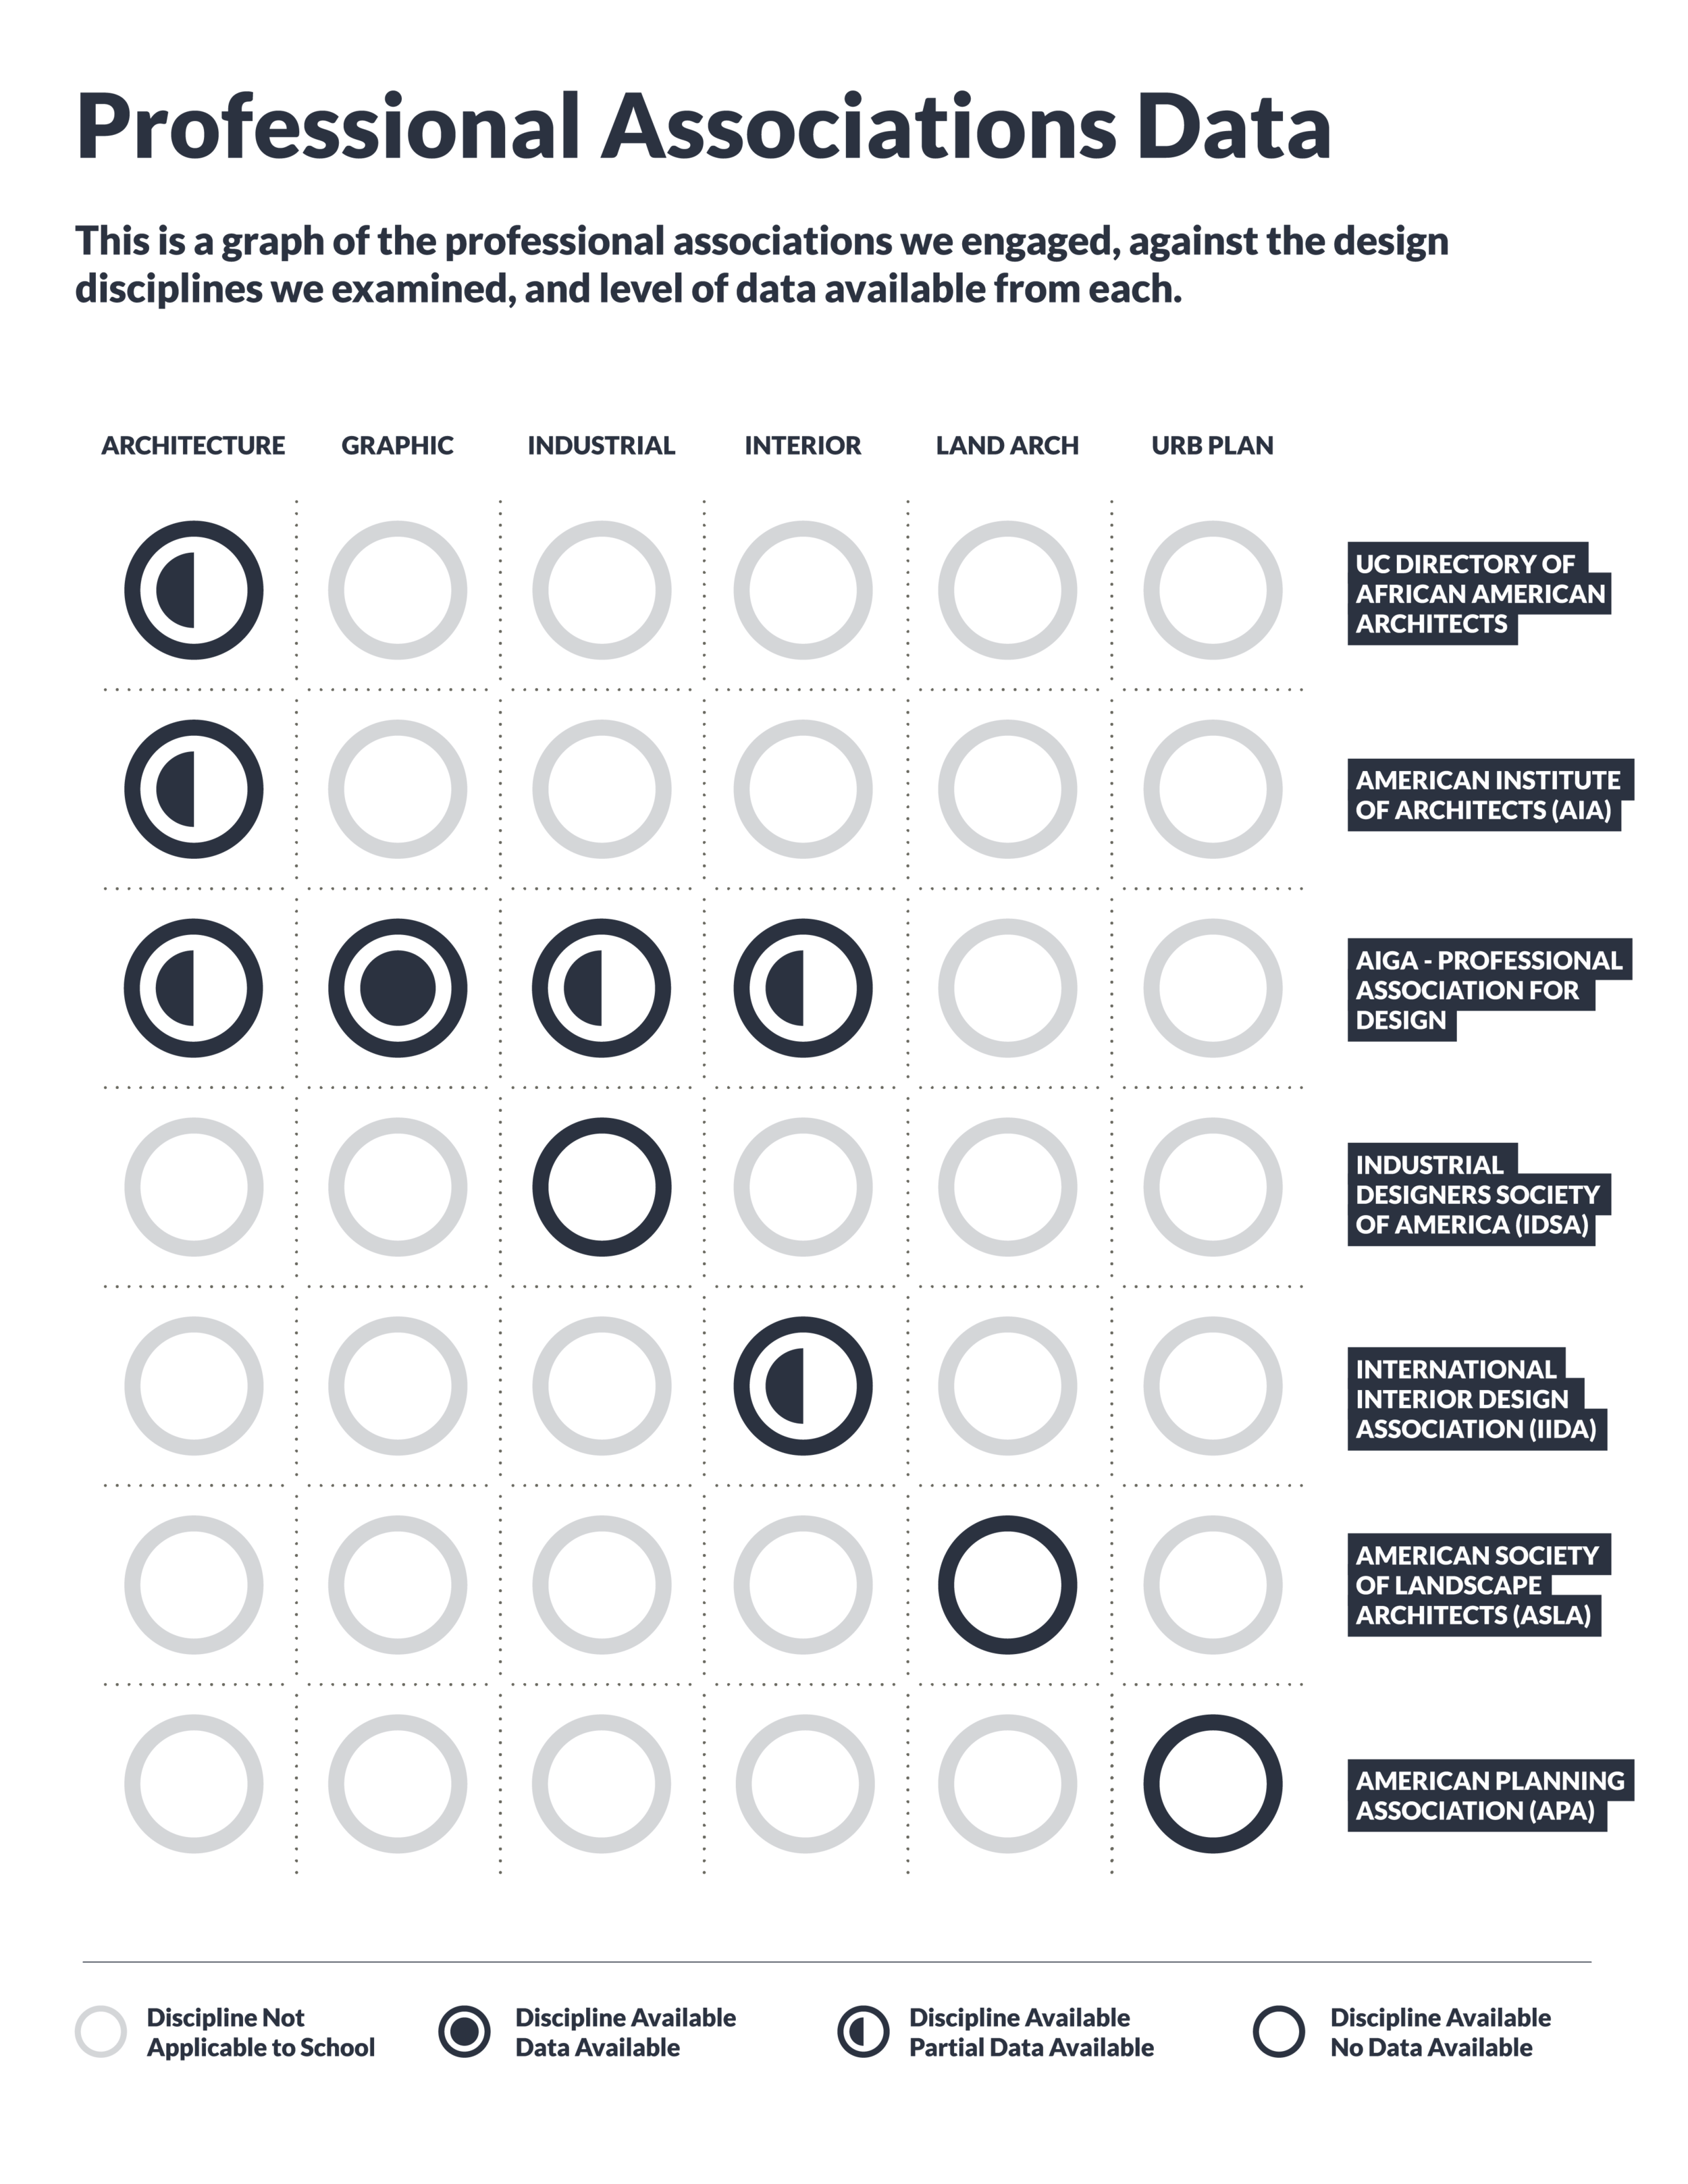
The following matrix presents demographic data available on design professionals in Ohio:
Diversity of Ohio’s Population
The demographic data on design professionals in Ohio can be compared to the overall demographic data on Ohio’s population to determine the level of ethnic representation in the state. According to the 2016 American Community Survey, Ohio’s total population is 11.6 million people.

Ohio’s Professional Design Associations
In order to estimate the current number of African American and Latinx design professionals in Ohio, the Design Diversity Index utilized data from three different sources:
- Professional design associations
- U.S. Census - Bureau of Labor Statistics
- The Directory of African American Architects
Professional design associations exist to build awareness of their particular discipline and advocate for the needs of their members. The professional design associations contacted through the project include:
- AIA - American Institute of Architects
- AIGA - The Professional Association for Design
- APA - American Planning Association
- ASLA - American Society for Landscape Architects
- IDSA - Industrial Designers Society of America
- IIDA - The Commercial Interior Design Association
Each of these professional associations represent at least one of the six design disciplines included in the Design Diversity Index. Most of the professional associations contacted during the project have initiatives to increase the diversity of their membership. The definition of the term “diversity” varies across the list of associations, from diversity of thought to diversity of specific ethnicities. Some diversity initiatives are led from the association’s national level, while others are generated by state or local city chapters. For example, the American Institute of Architects is the professional association for individuals in the field of architecture and carries out multiple diversity initiatives at national and local levels. In 2017, AIA adopted the following diversity statement for its national membership:
“The American Institute of Architects, as part of the global community, champions a culture of equity, diversity, and inclusion within the profession of architecture to create a better environment for all. Achieving this vision has a direct impact on the relevance of our profession and the world's prosperity, health, and future.”
The American Planning Association adopted a Diversity and Inclusion Vision, Mission and Strategy in April of 2018. It includes strategies for expanding the representation of diverse and inclusive perspectives within the planning profession, and for recruiting and retaining underrepresented people in the profession. But does not specify tracking measures or tools. Based on information gathered from association websites, reports, and personal communications, all of the listed associations recognize African American and Latinx individuals are underrepresented in their respective professions.
Design Professionals Data
In addition to gathering available data from professional design associations, the Design Diversity Index also collected data from the Bureau of Labor Statistics. Many professional associations currently do not collect demographic data at the state level. In addition, membership in professional associations may not accurately reflect the diversity of the profession as a whole. Based on anecdotal evidence collected by the project team, African American and Latinx individuals may feel uncomfortable joining professional organizations with low representation of their ethnic community. Hypothetically, even if more data was available from professional associations, the data might underrepresent the actual number of people of color in the design professions. Therefore, in order to gain a more well-rounded assessment of diversity in Ohio’s design professions, multiple sources of data must be collected and compared.
The Design Diversity Index used the most recent data set available from the U.S. Bureau of Labor Statistics, which includes Occupation, State, and Ethnicity categories. The data was collected through the 2016 American Community Survey. Although the data set includes many occupations, it only identifies three occupational categories relevant to the Design Diversity Index. The three design occupations included in the 2016 ACS data are: Architects (OCCP code: 1300), Urban and Regional Planners (OCCP code: 1840), and Designers (OCCP code: 2630).
Architects and Urban/Regional Planners match up with two of the six design disciplines defined by the Design Diversity Index. But the “Designers” category is broader than any one professional discipline. Respondents to the ACS who categorized themselves as “designers” might also identify with a more specific professional category unavailable in the data, such as graphic designer, industrial designer, interior designer or landscape architect. For this reason, the current ACS data is limited to providing an overview of architects and urban planners, but only an aggregate sense of ethnic diversity in the other four design professions.
Architects
As of 2016, data from the Bureau of Labor Statistics includes a total of 5,908 individuals identified as architects in Ohio. Of this total, the majority 84.29% identify as White (4,980). The second highest ethnicity is Hispanic at 4.87% (288), followed by Asian at 4.62%. After Asian, the fourth highest ethnic category is Other at 3.59% (212), which likely includes Pacific Islanders, Native Americans, and individuals who chose not to provide an ethnicity. The fifth highest category includes individuals with two or more ethnicities at 1.34% (79). The ethnicity defined by the American Community Survey with the lowest percentage of architects is African American with 1.29% (76).

Urban Planners
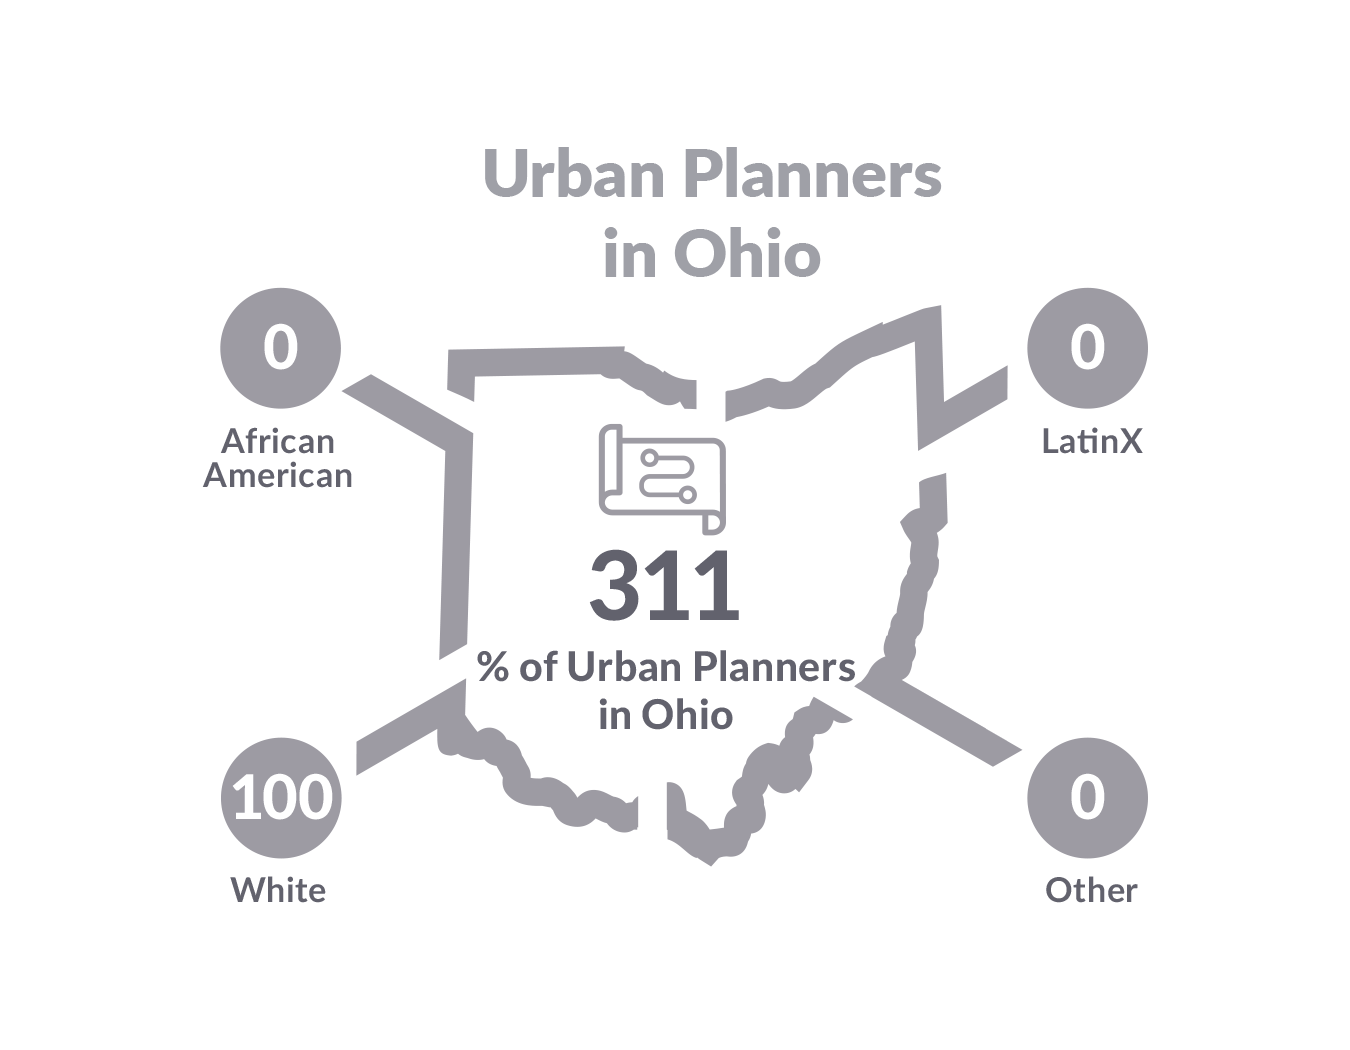
The data collected by the Bureau of Labor Statistics uses the term “Urban and Regional Planning” for the occupation labeled simply as “Urban Planning” in the Design Diversity Index. The Bureau of Labor Statistics data was collected through the 2016 American Community Survey. Remarkably, the data for Urban and Regional Planners indicates no representation from ethnicities other than White in Ohio. The total number of individuals categorized in this occupation is 311. Of this total, 100% are identified at White (311). The data shows no individuals in Urban and Regional Planning with African American, Hispanic, Other or Two or More ethnicities.
Based on the project team’s personal knowledge, at least a few urban planners in Ohio are African American. The complete lack of African Americans in the state labor data may be due to the relatively small number of respondents to the 2016 American Community Survey—not all planners in Ohio respond to the survey. The actual percentage of African American urban planners might be in the low single digits, landing within the data’s margin of error.
In addition to drawing data from the Bureau of Labor Statistics, future versions of the Design Diversity Index may include demographic data provided by the American Planning Association (APA). The national and state chapters of APA do not currently collect data on both the location and ethnicity of its members. But APA leadership has expressed interest in collecting this data. In the next year or two, APA may send surveys to its members with African American and Latinx demographic questions. This new dataset would provide a useful complement to state labor statistics in order to more accurately estimate the diversity of Ohio’s urban planning professionals.
Designers
The Bureau of Labor Statistics data from the 2016 American Community Survey includes the occupation “Designers,” alongside “Architects” and “Urban and Regional Planning.” These three categories are the only occupations relevant to the six design disciplines identified by the Design Diversity Index. The term “Designers” is too general to assign to any one discipline used by the Design Diversity Index. It may include designers from multiple disciplines, including Industrial Designers, Graphic Designers, Interior Designer, and Landscape Architects. But the demographic data for general Designers serves as a useful point of comparison to Architects and Urban Planners.
According to the 2016 ACS data, a total of 31,630 Ohioans identified themselves as Designers. The data shows the vast majority of Designers are White: 89.29% (28,242). The second highest ethnic group is African American with 3.77% (1,191). The third largest ethnicity is Asian with 3.06% (968), followed by Hispanic with 2.78% (880). The fifth largest category includes individuals with two or more ethnicities. Lastly, the lowest number of individuals, 0.37% (117), identified as Other.

Summary of Key Findings
The data shown on Ohio's Professional Workforce reveal several interesting findings:
- Based on limited data available from the American Community Survey, the urban planning profession retains the lowest representation from people of color among the design disciplines. No African Americans or Latinx urban planners were shown in the data. Surveys from the American Planning Association may provide more accurate and detailed information to track demographic changes in the future.
- African Americans are the second largest ethnic group in Ohio (12.2%), but have the lowest representation in architecture among the five ethnic groups (African American, Hispanic, Asian, White, and Other). According to the American Community Survey, only 1.29% (76 people) of Ohio's architects are African American.
- The percentage of African Americans categorized as "designers" in Ohio's labor data is significantly higher than architects or urban planners. Individuals in this broad occupational category could be engaged to consider careers in design disciplines with lower demographic representation.
- Available in late 2018, new American Community Survey data will include missing information on Ohio's design professions.